Lean
A way of running an organisation that delivers what the customer values with the least waste, by making work flow and by developing people to solve problems where they happen.
Value flows. Waste waits.
Most of the time a product spends in a plant, nothing is happening to it. Lean is the discipline of finding that waiting and removing it. Try it on the pipe line: change the batch size and watch when the first pipe reaches the customer.
This lesson covers what lean is, the house of lean, 518 lean terms (152 core tools with worked mill examples), five experiments, two quizzes and two printable posters.
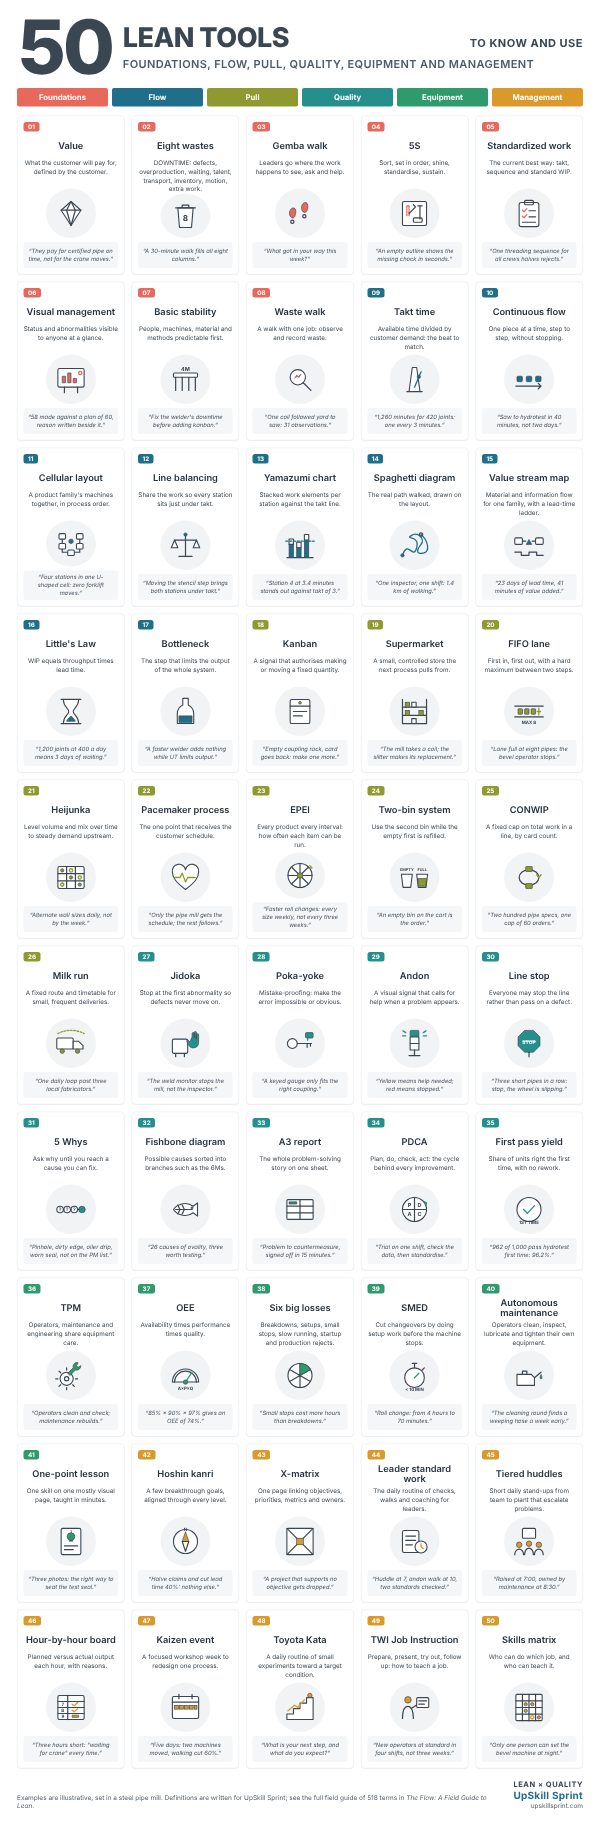
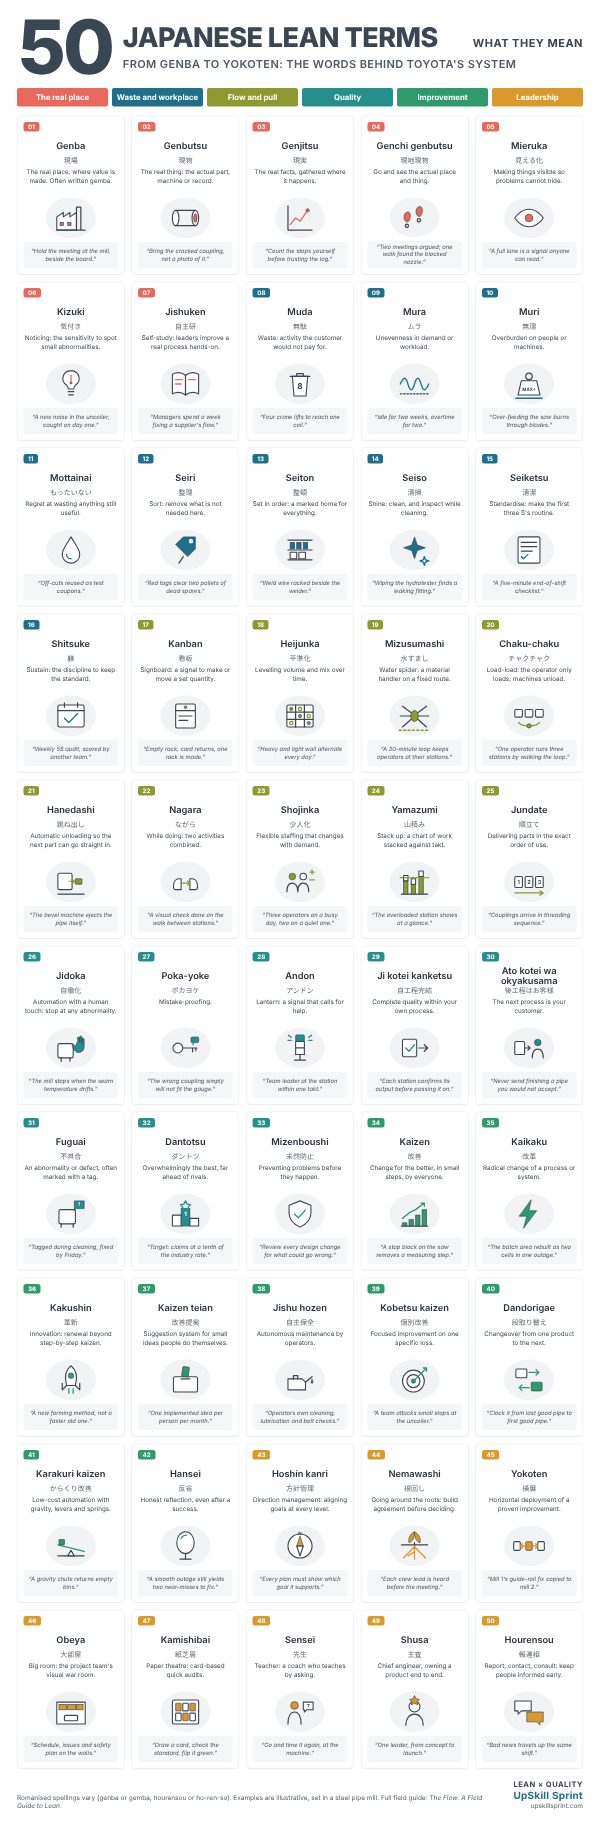
Two one-page PDF posters for the office wall, the training room or your next kaizen event. Each card has a number, a plain definition, an icon and a mill-floor example.
Lean is a way of running an organisation that delivers what the customer values with the least waste, by making work flow and by developing people to solve problems where they happen.
It grew out of the Toyota Production System in post-war Japan, when Toyota could not afford the large batches, big warehouses and armies of inspectors that mass production relied on. It had to make cars in small quantities, in many variants, with little cash. So it learned to make only what was needed, to stop the moment something went wrong, and to keep improving the work every day.
Three ideas carry most of the weight:
Flow. A product should move from step to step without waiting. Most lead time is waiting, so most of the opportunity is there, not in making machines faster.
Built-in quality. Defects should be caught where they are made, by people and machines that stop when something is wrong, instead of being inspected out at the end.
People. The people who do the work are the ones who improve it. Tools like kanban and 5S are only the visible part; the habit of solving problems is the engine.
The word "lean" came later, from a 1988 MIT paper by John Krafcik, and was popularised by the 1990 book The Machine That Changed the World. Toyota still mostly calls it TPS.
For a single station with random arrivals and random work times (an M/M/1 queue), average waiting time as a multiple of processing time is \(u/(1-u)\), where \(u\) is utilisation.
Busy is not the same as flowing.
The story is told about Taiichi Ohno, the engineer behind the Toyota Production System. A manager or engineer would come to him with a problem. Ohno would take them to the shop floor, draw a chalk circle and tell them to stand in it and watch. He would come back hours later and ask what they had seen.
If the answer was "nothing much," they stayed in the circle. What was he waiting for them to notice? Think about it before you reveal the answer.
He wanted them to see the waste with their own eyes: the operator waiting for a machine, the pile of parts between steps, the walk to fetch a tool, the small stop nobody logs. None of it shows up in a report. All of it is obvious from the circle once you stop looking for activity and start looking for flow.
That is genchi genbutsu, go and see. It is still the first step of almost every good lean project, and the cheapest one.
You are standing in the circle at a pipe finishing line. Match each thing you see to one of the eight wastes (DOWNTIME).
The Toyota house is the classic way to sort the whole toolbox. Two pillars hold up the roof, and both stand on a foundation of stability and people. Every term in the field guide belongs to one of the three.
The just-in-time pillar: takt, flow, pull and levelling. Make only what is needed, when it is needed, in the amount needed.
"Is the work moving, or waiting?"
The jidoka pillar: stop at the first abnormality, mistake-proof the process, keep equipment capable and solve problems at the root.
"Would we stop if something went wrong?"
The foundation and centre: standard work, 5S, visual and daily management, strategy, and the people who improve the work every day.
"Is there a standard, and who is improving it?"
Select any part of the house to jump to its terms in the field guide.
Five small experiments with illustrative mill numbers. Move the sliders, hover the charts for exact values, and watch where the time goes.
At a fixed throughput, every joint you add to work in process adds waiting, not output.
Four finishing stations stacked against takt. Change demand, then rebalance the work.
A 480-minute shift on the cut-to-length line. Add losses and watch them multiply.
A 240-minute size change. Tick each task that could be done while the mill is still running the last order.
Twenty days of random demand averaging 100 joints a day. Push builds to a forecast of 115; pull replaces what was taken.
152 core tools have a plain definition and a worked mill example; tap "Show example" on any core card. The other 366 are "know the name" terms: a one-line definition so you recognise them in a book, an audit or an exam. Search, filter by family, or show only core tools or Japanese terms.
A way of running an organisation that delivers what the customer values with the least waste, by making work flow and by developing people to solve problems where they happen.
Toyota's production system, usually drawn as a house: just-in-time and jidoka are the pillars, standard work and levelled production are the foundation, and people improving the work sit at the centre.
Womack and Jones's summary of lean thinking: specify value from the customer's view, map the value stream, make value flow, let the customer pull, and pursue perfection.
Treating the people who do the work as the experts on it: challenging them, listening to them and building their problem-solving skill, not just using their hands.
The habit of improving every process a little, all the time, by everyone, rather than waiting for big projects or crises.
Japanese for "go and see the actual place and the actual thing." Understand a problem by observing it where it happens, not from reports or meetings.
The small set of long-term ideals an organisation steers by, such as zero harm, zero defects and 100% value-added flow, used to judge whether a change moves in the right direction.
The way of seeing work that lean asks for: start from customer value, look at the whole flow, and treat every problem as a chance to learn.
The term coined in the MIT study of world car making (popularised by The Machine That Changed the World) to describe Toyota-style production; the root of the word "lean".
Lean applied to making physical products; often used loosely for the whole set of lean tools.
Lean extended beyond one plant to every function and partner along the value stream, including sales, engineering, suppliers and customers.
Lean seen from the customer's side: designing how people buy and use a product so it solves their problem completely with the least of their time and effort.
Loose label for later versions of lean that add digital tools, data and newer management ideas; meanings vary by author.
Jeffrey Liker's grouping of the Toyota Way into Philosophy, Process, People and partners, and Problem solving.
Liker's fourteen principles describing how Toyota manages, from long-term thinking to becoming a learning organisation through reflection.
Toyota's own statement of values, built on two pillars: continuous improvement and respect for people.
Japanese for "the way things should be." The ideal condition a team compares reality against to define the gap it must close.
Japanese for "the art of making things." Pride in craft and in continually improving how products are made.
Japanese for "making experiences." Designing the value and experience around a product, not just the product itself.
Japanese expression of regret at waste: the sense that throwing away anything still useful is a loss.
Toyota's slogan (Yoi kangae, yoi shina) linking good products to the ideas of the people who make them.
Copying the visible tools of lean (boards, 5S tape, kanban cards) without the problem-solving culture that makes them work.
Treating lean as dogma, applying tools because "lean says so" rather than because they solve a problem in this place.
From Feynman's "cargo cult science": imitating the outward form of a successful system and expecting the results to follow.
The fifth lean principle: an ideal of zero waste that is never reached, which is why improvement never ends.
Looking at how parts of a process affect each other, so a local improvement does not quietly make the whole system worse.
An organisation that deliberately captures and spreads what it learns from every success and failure.
Treating each change as an experiment: predict, test, observe, learn. The habit Toyota Kata tries to build.
An attitude of never being satisfied with the current way, combined with the belief that anyone can improve it.
Japanese for "place." In Nonaka's knowledge theory, the shared physical or mental space where people create knowledge together.
Work that changes the product in a way the customer cares about and would pay for, done right the first time.
Any activity that consumes time or resources without changing the product in a way the customer values. Some of it is necessary for now; the rest is pure waste.
Work that adds no value but cannot be removed yet because of regulation, contract or current technology. Also called business-value-added. Reduce it, then design it out.
Japanese for "waste": anything that uses resources without adding value for the customer.
Japanese for "unevenness": fluctuation in workload or demand that forces people and equipment to swing between idle and overloaded.
Japanese for "overburden": pushing people or machines beyond a natural limit, which causes injuries, breakdowns and defects.
Ohno's seven types of production waste: Transport, Inventory, Motion, Waiting, Over-processing, Over-production and Defects.
A memory aid for eight wastes: Defects, Over-production, Waiting, Non-utilised talent, Transport, Inventory, Motion and Extra-processing.
Making more, sooner or faster than the next process or customer needs. Ohno called it the worst waste because it creates and hides all the others.
Raw material, work in process or finished goods beyond what is needed right now. It ties up cash and space and hides problems.
People, machines or material standing idle because the previous step, information or approval has not arrived.
Moving material between locations without changing it. Every move costs time, labour and risk of damage.
Unnecessary movement of people: reaching, bending, walking and searching.
Doing more work, or more precise work, than the customer requires. Also called extra-processing.
Products or information that are wrong and must be scrapped, reworked, re-inspected or explained to a customer.
The eighth waste: not using the knowledge, skills and ideas of the people doing the work.
A structured walk through a process with the sole purpose of observing and recording waste, usually with a checklist of the eight wastes.
What a customer is willing to pay for, defined by the customer, not by the producer.
The three enemies of flow taken together. Unevenness and overburden usually create the waste, so lean levels the load before it hunts the waste.
Mary and Tom Poppendieck's translation of the seven wastes to software: partially done work, extra features, relearning, handoffs, delays, task switching and defects.
Waste that has become so normal it is no longer seen, such as routine searching, re-entering data or walking for tools.
Observing a single operator's movements in detail to find unnecessary reaching, turning and walking.
Customer orders that swing in volume or mix from day to day; the external source of mura that levelling is designed to absorb.
Japanese for wandering about aimlessly. Used in lean to describe people or material moving without purpose.
A five-step method for an organised, clean, safe workplace: Sort, Set in order, Shine, Standardise and Sustain. It makes abnormalities visible.
Marking items of doubtful use with a red tag and moving them to a holding area, where they are kept, moved or disposed of by an agreed date.
A board with the outline of each tool drawn on it, so tools have a fixed home and a missing one is obvious at a glance.
Keeping tools, parts and supplies right where they are used, in the quantity needed.
The current best way to do a job safely, documented with three elements: takt time, the work sequence and the standard amount of work in process. It is the baseline for improvement.
A chart that shows how an operator's manual work, walking and machine time combine over one cycle, drawn against the takt time.
A table of each machine's manual time, automatic time and tool-change time, used to calculate how many parts the process can make per shift.
The minimum number of parts that must be inside a cell for it to run smoothly at takt, including parts sitting in machines.
Predictable availability of the 4Ms (manpower, machines, materials and methods) so the process can run to a standard before flow and pull are added.
A simple improvement checklist applied to each step: can we Eliminate it, Combine it, Rearrange it or Simplify it?
Japanese for a near-miss ("startled and gasped"). Reporting them is how a plant learns before an injury happens.
First S: remove everything not needed for the work at this location.
Second S: give every needed item a marked home near the point of use, so anyone can find and return it.
Third S: clean the area and equipment, and use the cleaning as an inspection for leaks, wear and damage.
Fourth S: make the first three S's routine with simple standards, checklists and visual rules.
Fifth S: build the discipline and leadership routines that keep the standard from slipping.
5S with Safety added as an explicit sixth step.
A British relabelling of 5S: Clear out, Configure, Clean and check, Conform, Custom and practice.
A layout sketch showing the operator's walk path, the work sequence and where standard WIP and safety checks sit.
Japanese for "three standard forms": the process capacity sheet, the standard work combination sheet and the standard work chart used together.
Japanese for standardized work.
Man (people), Machine, Material and Method: the four sources of process variation. Sometimes extended with Measurement and Mother nature (environment).
A form for timing each element of a job over several cycles to find the lowest repeatable time and the sources of variation.
The smallest practical unit of work that can be timed and moved to another operator, such as "load pipe" or "start cycle".
Timing a job directly with a stopwatch or video to set a standard time.
Estimating how time is spent by observing at random moments and counting how often each activity is seen.
A predetermined time system that builds a job's standard time from tabulated times for basic motions such as reach, grasp and move.
Maynard Operation Sequence Technique: a faster predetermined time system based on standard sequences of motions.
A written procedure for a task. Lean standard work is a stricter version tied to takt and sequence.
A work instruction that relies mainly on photos and diagrams, kept at the workstation.
Painted lines and shapes that show walkways, storage locations, WIP limits and hazard zones.
Designing work to fit the human body, to cut injury risk, fatigue and the defects they cause.
Rapid Upper Limb Assessment and Rapid Entire Body Assessment: scoring methods for the injury risk of a work posture.
Japanese hazard-prediction training: a team studies a picture or task and predicts what could go wrong before the work starts.
Heinrich's model that many near-misses and minor incidents sit beneath each serious injury, so reducing the base reduces the top.
Kitanai, kitsui, kiken: dirty, demanding and dangerous. Work conditions lean aims to remove.
A painted line or tape marking a maximum stock height or WIP level; material above the line signals over-production.
All the steps, value-adding or not, that take a product from raw material (or order) to the customer, including the information flow that triggers them.
A one-page map of material and information flow for one product family, with times, inventories and a timeline that separates value-added from total lead time.
Moving product one piece (or one small batch) at a time through each step without stopping or stockpiling in between. Also called one-piece flow or single-piece flow.
The pace of customer demand: available working time divided by the quantity the customer needs in that time. It sets the beat every process should match.
How often a part actually comes off a process, or the time one operator needs to complete their work on one part. Always state which definition you mean.
The total time a product or order spends in a process, from entering to leaving, including all waiting.
In a stable system, average work in process equals throughput multiplied by average lead time. Cut WIP and lead time falls by the same proportion.
Material that has started processing but is not finished.
Arranging the machines and people for a product family close together, in process order, so work flows through a cell instead of travelling between departments.
Japanese for "load-load." A cell where the operator only loads each machine and walks on; machines unload themselves, so the operator never waits.
Distributing work elements across stations or operators so each one's workload is close to takt time and nobody is overloaded or idle.
Japanese for "stack up." A stacked bar chart of each operator's or station's work elements against the takt line, used to balance work.
The step with the least capacity relative to demand. It sets the output of the whole process; an hour lost there is an hour lost for the plant.
A drawing of the path a person or product actually travels through an area. The tangle shows wasted transport and motion.
A group of products that pass through similar process steps and equipment, so they can share a value stream, cell or schedule.
Producing in smaller lots so material moves sooner, lead time falls and problems surface faster. Usually depends on shorter changeovers.
Takt time multiplied by the pack-out quantity: the interval at which a container of finished work should be withdrawn.
Value-added time divided by total lead time. In most factories it is well under 10%.
The "as is" value stream map and the target "to be" map drawn from it, with a plan to close the gap.
A cell laid out in a U so the first and last steps sit side by side and one operator can cover several machines with little walking.
Automatic unloading and orienting of a part when a machine finishes, so the next part can be loaded straight away. The enabler of chaku-chaku.
Japanese for "while doing." Combining two activities at once, such as doing a check while walking between stations.
Flexible staffing: varying the number of operators in a line or cell with demand, which needs cross-trained people and flexible layouts.
A bar chart of each operator's total cycle time compared with takt; a yamazumi chart without the element detail.
In the Theory of Constraints, whatever limits the system from producing more of its goal. It may be a machine, a policy or the market.
Christoph Roser's method of finding a shifting bottleneck by walking the line and noting which processes are working, waiting or blocked.
Finding the bottleneck from machine data by identifying which process has the longest uninterrupted active periods.
Product-quantity analysis: a Pareto of volume by product number, used to separate high-volume runners from low-volume items before designing flow.
Product-routing analysis: a matrix of products against process steps, used to find products with similar routings that can form families.
The quantity a process makes between changeovers versus the quantity moved to the next step at once. Moving smaller transfer batches overlaps the steps.
A production system where all products follow the same sequence of steps, like a line.
A production system where products take varied routes through functionally grouped machines; flexible but hard to flow.
A large, expensive, hard-to-move machine that forces products to queue and travel to it.
Small, simple, dedicated machines sized for a product family's takt, instead of large shared monuments.
A rapid design method that uses cardboard mock-ups and many alternative concepts to design a new process or product for flow.
Building full-size cardboard or wooden mock-ups of a workstation or cell so operators can test the layout before metal is cut.
A line designed so the number of operators can change with demand while still meeting takt (see shojinka).
A self-balancing way to share work along a line: each worker carries a part forward until taking over the next worker's part, then walks back.
A short overlap zone between operators where either can do the work, so small differences in cycle time balance themselves.
Workstations in sequence where a product is built up step by step.
An assembly line where the product moves continuously past the workers at a fixed speed; Ford's 1913 breakthrough.
A small group of assembly stations arranged for one product family, usually staffed by a few cross-trained operators.
A plant or plant-within-a-plant dedicated to a narrow set of products or markets, so it can be simple and excellent at one thing.
The physical movement of material through the value stream.
The flow of orders, schedules and signals that tells each process what to make; drawn across the top of a value stream map.
Material and Information Flow Analysis / Diagram: German names for value stream mapping.
A diagram of every step, move, delay, inspection and storage in a process, often with standard symbols.
A process map divided into lanes by role or department, showing where work is handed over.
Business Process Model and Notation: a standard graphical notation for business process maps.
Takt time adjusted for known losses, such as planned downtime or expected scrap; the speed the line must actually run.
Takt calculated purely from customer demand, before any adjustment for losses.
An approximation for queue waiting time that shows how waiting explodes as utilisation nears 100% and as variability grows.
Stock, time or capacity held deliberately to protect flow from variation.
Falling unit cost from larger volumes. Lean questions it when large batches add inventory and lead time.
Rising unit cost as an operation grows too large: complexity, coordination and long queues.
Improving the flow of material and information across a whole value stream, usually led by managers.
Improving one process or station, usually led by the people who work there.
Building different products on the same line in a levelled, repeating sequence rather than in long single-product runs.
Another name for process cycle efficiency.
The rate at which a process delivers finished output, such as joints per day.
The maximum output a resource can sustain in a given time.
The share of available time a resource is busy. Pushing it toward 100% makes queues and lead times grow rapidly.
Time from raw material arriving at the receiving dock to finished goods leaving the shipping dock.
Production of many different products in small quantities, where classic lines and kanban are hard to apply.
Production of few products in large quantities, the setting where flow lines are most natural.
A rough layout sketch in which circles represent areas and lines show the flows between them.
Improving or rebuilding an existing plant, with all its constraints.
Designing a new plant on an empty site, free to lay it out for flow.
A fully automated plant that can run without people present.
One of the two TPS pillars: making and delivering only what is needed, when it is needed, in the amount needed.
Production in which each process makes only what the next process has taken away, so consumption, not a forecast, triggers work.
Japanese for "signboard." A card, bin or signal that authorises a process to produce or move a set quantity. The number of kanban caps the inventory in the loop.
Calculating how many kanban a loop needs, usually daily demand times replenishment lead time plus safety stock, divided by container quantity.
The simplest pull system: when the first bin of a part is empty, it is sent for refill while the second bin is used.
A small, controlled store of parts at a process, from which the next process withdraws what it needs; withdrawals trigger replenishment.
A first-in, first-out lane with a fixed maximum quantity between two processes. When it is full, the upstream process stops.
Japanese for "levelling." Smoothing production by both volume and product mix over time, so upstream processes and suppliers see a steady demand.
A slotted board that holds kanban by product and time interval, used to release work to the pacemaker in a levelled sequence.
The single point in a value stream that receives the customer schedule; everything upstream is pulled from it and everything downstream flows from it.
The time it takes to cycle through every product in a family on a shared process. Shorter changeovers allow a shorter EPEI and less inventory.
A fixed, repeating production sequence for a shared process, sized by EPEI. Common in process industries such as steel, chemicals and paper.
A database with every purchased part's usage, supplier, container, storage location and replenishment method; the basis for lean material handling.
A material handler who runs a fixed route at a fixed pitch, delivering parts and collecting kanban, so operators never leave their stations.
A fixed route and timetable for picking up or delivering small quantities from several points, inside a plant or between suppliers.
Delivering all the parts for one job or product together as a kit, so the operator does not pick them one by one.
Constant work in process: a pull system that caps total WIP in a whole line with a fixed number of cards, rather than one loop per part number.
The Theory of Constraints scheduling method: the constraint sets the pace (drum), a time buffer protects it, and material release is tied to its pace (rope).
Extra inventory held to protect against variation in demand or supply.
Small changes in consumer demand growing into large swings further up the supply chain as each tier over-reacts.
Classifying products by how often they are made (constantly, regularly, rarely) so each group gets a suitable scheduling method.
Production released to a schedule or forecast regardless of whether the next step is ready; the opposite of pull.
A kanban that tells a process what and how much to make.
A kanban that authorises moving a quantity from a supermarket to the process that uses it. Also called a move or conveyance kanban.
A kanban for a process that must make batches: when stock falls to a trigger point, the signal launches one batch. Often a triangle-shaped card.
A kanban that orders material from an outside supplier.
An electronic kanban system: scanning or sensor signals replace physical cards.
A mailbox where kanban cards are dropped for collection and return to the supplying process.
Last in, first out: using the newest stock first. Usually bad for traceability and ageing material.
Joke acronym, "first in, still here": stock that never moves because new material is always used first.
A production schedule that repeats the same sequence and quantities each cycle, adjusted only occasionally.
Spreading volume evenly over time to avoid peaks and troughs in workload.
Multi-loop CONWIP: several overlapping CONWIP loops across a value stream.
Paired-cell Overlapping Loops of Cards with Authorization: QRM's card system for controlling flow between cells in high-mix shops.
Control of Balance by Card-Based Navigation: a card-based order release and workload control method for job shops.
Watching how much of a TOC buffer is consumed (green, yellow, red) to decide which orders need expediting and what to improve.
A Toyota technique that links two points on a line so material moves between them only when the first has a part and the second is empty.
Japanese for "ready, set, go." A start signal that synchronises several operators so they all begin a cycle together.
Delivering parts not only on time but in the exact order they will be used.
Japanese term for delivering parts in production sequence (just-in-sequence).
Producing to a forecast and holding finished goods to ship immediately.
Producing only after a customer order is received.
Designing and producing a unique product for each order.
Holding components and assembling the final product to order.
Producing large volumes of standard products at low unit cost, typically in large batches.
Producing customised products at close to mass-production cost, usually through modular design and flexible processes.
A formula that balances ordering or setup cost against holding cost to choose a lot size. Lean attacks the setup cost instead of accepting it.
Annual cost of goods sold divided by average inventory value; how many times a year the stock is replaced.
How many days current inventory would last at the current rate of use.
Material Requirements Planning: calculating component needs and order dates from a master schedule and bill of materials. Usually a push system.
Manufacturing Resource Planning: MRP extended to capacity, finance and other resources.
Demand Driven MRP: places stock buffers at strategic points and replenishes them from actual demand, blending MRP with pull.
A scheduling rule that runs jobs in order of due date.
A monthly process that aligns sales forecasts, production capacity and inventory plans across functions.
Ranking items by annual value or volume into A (few, important), B and C (many, minor) classes.
ABC by volume combined with XYZ by demand variability, giving nine classes that suggest different replenishment methods.
Japanese for delivering parts "naked," without their own packaging, on racks designed for them.
Custom containers or racks that hold and protect one part type in a fixed count and orientation.
One of the two TPS pillars: building quality in by giving machines and people the ability to detect an abnormality and stop, so defects are never passed on. Also called autonomation.
Automation with a human touch: machines that stop themselves when something goes wrong, so one person can watch several machines.
Making it impossible or immediately visible to make a defect at each step, rather than inspecting quality in at the end. Also called quality at the source.
Japanese for "mistake-proofing." A simple device or design that prevents an error or makes it obvious immediately. An older name was baka-yoke ("fool-proofing").
Shigeo Shingo's approach of combining source inspection with poka-yoke so that defects are prevented rather than found.
A visual (and often audible) signal, such as a light or board, that shows the status of a process and calls for help when there is a problem.
Giving everyone the authority, and the duty, to stop the line when a defect or abnormality appears, so the problem is fixed instead of passed on.
A small, voluntary group of workers from the same area who meet regularly to identify and solve quality problems with simple tools.
An organisation-wide approach in which everyone takes responsibility for quality, guided by customer focus, data and continuous improvement.
The share of units that go through a process correctly the first time, with no rework or repair. Also called first time through (FTT).
The probability a unit passes every step first time: the product of each step's first pass yield.
All the unplanned rework, repair, re-inspection and expediting that consumes capacity without appearing in normal reports.
The total cost of producing defects: scrap, rework, warranty, claims, extra inspection and lost customers.
A document listing each product and process characteristic, its specification, measurement method, frequency and reaction plan.
Failure Mode and Effects Analysis for a process: listing how each step could fail, the effect, causes and controls, and ranking the risks to act on.
Using control charts to tell routine variation from special causes, so the process is adjusted only when it has really changed.
Checking the conditions that cause defects (settings, material, method) before processing, rather than checking the product afterwards.
Operators inspecting their own work immediately, ideally with a poka-yoke.
Each operator checks the work of the previous step before adding their own.
A cord or button that lets an operator signal a problem and, on a paced line, stop it if help does not arrive in time.
A line that, once the andon is pulled, stops at the end of the current cycle so work is not left half done.
The standard response to an abnormality: stop the work, call for help, and wait rather than improvise.
Japanese for "completing quality in your own process": each process confirms its output is good before passing it on.
Japanese for "the next process is your customer." Never pass a defect downstream.
Philip Crosby's standard that the goal is no defects at all, with every error treated as preventable.
The idea that visible quality costs, such as scrap, are a small tip above much larger hidden costs.
A clearly marked container for defective or suspect parts, reviewed regularly so problems are seen and solved.
A short notice posted at the workstation that describes a recent defect, how to spot it and what to do.
The number of defective units per million produced, often used for supplier quality. Not the same as DPMO, which counts opportunities.
Acceptance Quality Limit: the worst average defect rate a sampling plan will accept as satisfactory.
Advanced Product Quality Planning: a structured automotive framework for planning quality into a new product and process.
Production Part Approval Process: the automotive evidence package proving a supplier's process makes conforming parts at rate.
Indices comparing the natural spread of a stable process with its specification limits.
The TPM pillar that keeps equipment in the condition needed for zero defects, by linking defect modes to machine conditions.
Japanese for "overwhelmingly the best." Used for quality programmes that aim to be far ahead of any competitor.
Japanese for noticing or becoming aware: the sensitivity to spot small abnormalities before they become problems.
Comparing a product with a standard. Lean treats inspection after the fact as waste to be designed out with built-in quality.
Plan, Do, Check, Act: the basic improvement cycle of planning a change, trying it, checking the results and standardising or adjusting. Also called the Deming or Shewhart cycle.
Toyota's structured problem-solving story on one A3 sheet: background, current condition, goal, root cause analysis, countermeasures, plan and follow-up.
Asking "why?" repeatedly, usually about five times, to move from a symptom to a root cause that can be fixed.
A disciplined search for the underlying cause of a problem, so the fix stops it from coming back rather than treating a symptom.
A cause-and-effect diagram that sorts possible causes of a problem into branches such as the 6Ms. Also called an Ishikawa diagram.
Eight Disciplines: a team problem-solving method for customer complaints, from containment through root cause and corrective action to preventing recurrence and recognising the team.
Check sheet, histogram, Pareto chart, cause-and-effect diagram, scatter diagram, control chart, and stratification (or a flow chart in some lists).
A bar chart of categories in descending order with a cumulative line, used to find the "vital few" causes behind most of a problem.
Affinity diagram, interrelationship digraph, tree diagram, matrix diagram, prioritisation matrix, process decision program chart and activity network diagram, used for messy, qualitative problems.
Contrasting where, when and how a problem occurs with where it could occur but does not, to narrow the possible causes.
Japanese for "reflection." Honest self-reflection on what went wrong and what you will do differently, even after a success.
Immediate action to protect the customer from a problem, such as quarantining suspect stock, while the root cause is found.
Plan, Do, Study, Act: Deming's preferred wording, stressing learning from the results over simply checking them.
Toyota's Practical Problem Solving: clarify the problem, break it down, set a target, find the root cause, develop countermeasures, implement, check, standardise.
A simple form for tallying how often events occur, often by type, time or location.
A bar chart of how often values fall in each range, showing the shape and spread of a data set.
A plot of paired data to see whether two variables move together.
Splitting data by source (shift, machine, supplier) to reveal differences that the combined data hides.
A line chart of a measure over time, used to see trends, shifts and patterns.
A run chart with statistically calculated control limits that separate common-cause from special-cause variation.
Grouping many ideas or facts into natural clusters to reveal underlying themes.
A diagram of cause-and-effect links between issues, showing which are key drivers and which are outcomes.
Breaking a goal or problem into progressively finer levels of detail.
A grid showing the strength of relationships between two or more sets of items.
Scoring options against weighted criteria to choose among them.
Process Decision Program Chart: mapping what could go wrong at each step of a plan and the countermeasure for each.
A diagram of task sequence and durations used to find the critical path of a plan. Also called an arrow diagram.
Who, What, When, Where, Why and How: a checklist for describing a problem or plan completely. 5W2H adds How much.
A structured method for problem analysis, decision analysis and risk analysis based on careful specification of the problem.
A top-down logic diagram that traces how combinations of lower-level failures lead to a top event.
Dorian Shainin's approach of comparing best and worst parts to home in on the dominant cause of variation (the Red X).
A visual root cause method that maps cause-and-effect chains from a problem's impact on goals back to fixable causes.
Changing several factors together in a planned pattern to find which ones affect the result and how they interact.
A short team debrief after an event: what was supposed to happen, what happened, why, and what to do differently.
A concise, factual description of the gap between the current and the expected condition, without assumed causes or solutions.
Toyota's word for an action against a root cause. "Countermeasure" rather than "solution" signals that it may be improved later.
Generating many ideas quickly in a group, withholding judgement until the list is complete.
Ideas written individually, shared in turn, then ranked privately, so quieter members are heard equally.
Narrowing a long list by giving each person several votes to spread across their top choices.
A diagram that branches ideas outward from a central topic.
Listing the forces driving and restraining a change, to plan how to strengthen one side or weaken the other.
The theory of inventive problem solving: resolving technical contradictions using patterns found in thousands of patents.
Looking for a person to blame instead of a process to fix; lean treats it as the enemy of problem solving.
Japanese for "change for the worse," the opposite of kaizen.
A plant-wide approach to equipment reliability in which operators, maintenance and engineering share responsibility for preventing breakdowns, small stops, speed losses and defects.
\(\text{Availability} \times \text{Performance} \times \text{Quality}\): the share of planned time in which equipment makes good parts at its ideal speed.
The losses behind OEE: breakdowns, setups and adjustments, small stops, reduced speed, startup rejects and production rejects.
The TPM pillar in which operators take ownership of basic care of their equipment: cleaning, inspecting, lubricating and tightening.
A single-page, mostly visual lesson on one skill or point of knowledge, written by and for the people who use it, and taught in minutes.
Single-Minute Exchange of Die: Shingo's method for cutting changeover time by moving work outside the machine's stop time and streamlining what remains. The goal is under ten minutes.
Internal setup can only be done while the machine is stopped; external setup can be done while it runs. Converting internal to external is the heart of SMED.
The time from the last good part of one product to the first good part of the next, at full speed. Also written C/O.
Total Effective Equipment Performance: OEE multiplied by loading, so unscheduled time also counts as loss.
An OEE-style measure for people: availability, performance and quality of labour.
The TPM pillar for scheduled preventive and predictive work done by the maintenance team.
The TPM pillar of cross-functional teams attacking specific equipment losses.
The TPM pillar of designing new equipment using lessons from existing machines so it reaches full performance quickly.
The eight TPM pillars: autonomous maintenance, focused improvement, planned maintenance, quality maintenance, early equipment management, training, office TPM, and safety, health and environment.
Maintenance done on a schedule to prevent failure, rather than after it.
Maintenance timed by measured condition such as vibration, temperature or oil analysis.
Choosing the maintenance strategy for each failure mode based on its consequences and how it develops.
Clean, Inspect, Lubricate, Tighten: the core routine of autonomous maintenance.
Mean Time Between Failures: average running time between breakdowns of a repairable item.
Mean Time To Repair: average time to restore equipment after a failure.
A tag hung on equipment to mark an abnormality (fuguai) found during cleaning or inspection, until it is fixed.
Japanese for setup or changeover.
One-Touch and No-Touch Exchange of Die: changeovers reduced beyond SMED to a single action or to fully automatic.
General term for the methods, including SMED, that shorten changeovers.
Low-cost automation using gravity, springs, levers and cams instead of motors and controls.
Repairing equipment only after it fails.
TPM interpreted for the whole production system rather than maintenance alone.
Japanese for "the real place": where value is created, such as the shop floor or the desk where an order is processed. Also spelled genba.
A leader going to where the work happens to observe, ask questions and support problem solving, not to inspect or give orders.
Arranging the workplace so anyone can tell the status and see abnormalities at a glance, through boards, markings, signals and displays.
A visual device that not only shows status but tells people what to do, such as a full FIFO lane telling the upstream operator to stop.
A board at a process comparing planned and actual output each hour, with a note on the reason for any gap.
A cascade of short stand-up meetings each day: team, then area, then plant. Each reviews yesterday's performance and today's problems and escalates what it cannot solve.
A standard routine for supervisors and managers, listing the checks, walks and coaching they do each day or week, so the management system is sustained.
Japanese "paper theatre." A board of cards for quick audits: a leader picks a card, checks the standard it describes, and flips it to show the result.
Japanese for "big room." A room where a project or value stream team posts all its plans, metrics and problems on the walls and meets to manage them.
Taiichi Ohno's practice of drawing a chalk circle on the floor and having a manager stand in it to observe a process until they saw its problems. Also called the chalk circle.
Japanese for "making visible." Visual management in which normal and abnormal conditions can be seen at a glance.
A plant in which visual management is applied throughout, so it largely explains itself.
The board a team stands at for its daily huddle, usually with safety, quality, delivery and cost measures plus an action list.
A daily board tracking Safety, Quality, Delivery and Cost (sometimes People or Morale added as SQDCP or SQDCM).
Short, frequent audits of key process steps done by several levels of management on a schedule.
A display showing the status of several stations at once, often with the andon calls in progress.
A standard exchange of information between outgoing and incoming crews about status, problems and safety.
A defined rule for who gets called, and when, if a problem cannot be solved at the current level within a set time.
A display of key measures. In lean, the most useful dashboards are simple, current and posted where the work is.
Managers spending unscheduled time on the floor talking with people; the Western cousin of the gemba walk.
Making information so visible that anyone can see the state of the business and its problems.
The real place, the real thing and the real facts: the three "actuals" of Japanese problem solving.
The 3 Gen plus genri (principles) and gensoku (rules): check the facts at the real place, then compare with theory and standards.
Japanese for "the actual location," used in genchi genbutsu.
Japanese for "the actual thing": the real part, machine or document, not a description of it.
Japanese for "the actual facts," usually the data gathered at the gemba.
A board showing the status of each breakthrough objective deployed through hoshin kanri.
Japanese for "direction management." Policy deployment: choosing a few breakthrough objectives and aligning goals, plans and reviews at every level to achieve them.
The back-and-forth negotiation in hoshin kanri: a goal is "thrown" to the next level, which returns its plan and concerns until both sides agree.
A one-page hoshin tool that links long-term objectives, annual objectives, improvement priorities, metrics and owners through correlation grids.
A measure chosen because it shows progress toward an important goal. Fewer, well-chosen KPIs beat many.
The customer's needs and expectations, captured in their own words and translated into measurable requirements.
Accounting adapted to lean: measuring value streams rather than departments, reporting in plain language, and avoiding standard-cost incentives that reward overproduction.
Japanese for "radical change." A large, rapid transformation of a process or system, as opposed to small kaizen steps.
The English name for hoshin kanri.
A month-by-month table of target versus actual for each objective, coloured green or red like a bowling score sheet.
A breakdown of a top-level KPI into the lower-level drivers that each team can influence.
Measures watched to keep a process in control, versus measures used to track a specific improvement.
Goals that are Specific, Measurable, Achievable, Relevant and Time-bound.
Quality Function Deployment: a matrix that translates customer requirements into design and process characteristics.
A model that sorts product features into basic needs, performance needs and delighters, based on how they affect satisfaction.
Critical-to-Quality tree: breaking a broad customer need into specific, measurable requirements.
Quality, Cost, Delivery: the three basic dimensions of manufacturing performance.
The share of orders delivered on the promised date and in the full quantity.
How reliably orders arrive when promised, often measured as OTIF or on-time delivery.
Assigning costs directly to value streams instead of allocating overhead to products.
A lean accounting report that shows operational, capacity and financial measures for a value stream together.
The Theory of Constraints accounting method built on throughput, inventory and operating expense.
Starting from the price the market will pay, subtracting the required profit, and designing the product to that cost.
Japanese for "cost reduction."
Kaplan and Norton's framework of financial, customer, internal process and learning measures.
Drucker's approach of agreeing objectives with each employee. Deming criticised it when targets replaced process improvement.
Japanese for "innovation" or radical renewal, as distinct from step-by-step kaizen.
The Shingo Institute's framework of guiding principles, systems and tools used to assess operational excellence.
The European Foundation for Quality Management's framework for assessing organisational excellence.
International standard defining competencies for Lean, Six Sigma and Lean Six Sigma practitioners.
A project charter checklist: Background, Objectives, Scope, Constraints, Assumptions, Risks and Deliverables.
The Highest Paid Person's Opinion: decisions made by rank rather than evidence.
A live digital model of a physical asset or process, fed by its data, used to test changes without touching the real thing.
Connected, data-driven manufacturing using sensors, automation and analytics. Works best on top of a lean process, not instead of one.
Manufacturing Execution System: software that tracks and directs production on the shop floor.
The set of systems, including MES, that manage production, quality, maintenance and inventory operations.
Enterprise Resource Planning: integrated business software covering finance, orders, purchasing, inventory and planning.
The structured list of components and quantities needed to make a product.
A network diagram of which components "go into" which assemblies; a graphical bill of materials. A gozinto matrix is the table form.
Japanese for "change for the better." Continuous, incremental improvement by everyone, using the scientific method.
A focused, usually week-long workshop in which a cross-functional team analyses and changes one process. Also called a kaizen blitz or rapid improvement event.
An employee suggestion system focused on small improvements that people implement themselves.
Mike Rother's description of Toyota's improvement routine (the improvement kata) and the coaching routine (the coaching kata) used to make scientific thinking a habit.
A US wartime programme, later adopted by Toyota, that teaches supervisors three skills: Job Instruction, Job Methods and Job Relations.
A grid of people against tasks showing who is trained, who is proficient and who can teach, used to plan cross-training and cover.
Training people in several jobs so work can be balanced and absences covered.
Japanese for "teacher." An experienced lean coach who teaches mainly by asking questions and making the learner go and see.
Japanese for "going around the roots." Building consensus by talking proposals through individually with everyone affected before a decision is made.
Japanese for "horizontal deployment." Spreading a proven improvement and the learning behind it to similar processes elsewhere.
People changing their behaviour because they know they are being observed; a trap when timing a job.
A simple board or sheet listing problems raised, the countermeasure, the owner and the due date.
A small team that works together regularly on improvements in its own area.
Understand the direction, grasp the current condition, set the next target condition, and experiment toward it.
The coach's daily routine of five questions that develops a learner's improvement thinking.
Japanese for "form": a pattern practised deliberately until it becomes habit.
The TWI method for teaching a job: prepare, present, try out, follow up, built on a job breakdown sheet.
The TWI method for improving a job by questioning every detail.
The TWI method for handling people problems fairly and preventing them.
The TWI form listing a job's important steps, key points and the reasons for each key point.
An operator trained to run several machines or jobs; needed for cells and flexible staffing.
In TPS, a front-line role supporting a small team: responding to andon calls, covering absences and leading improvement.
A team that plans and manages its own work, schedules and improvements with little direct supervision.
Giving teams the authority, information and resources to make decisions about their own work.
Japanese for "making people." Developing people as deliberately as products are made.
Japanese for "self-study." Managers studying and improving a real process hands-on, often at a supplier, to learn by doing.
Report, contact, consult: the Japanese workplace habit of keeping others informed early.
A small central team that trains, coaches and supports lean improvement across the organisation.
A person who leads or catalyses change and helps others through it.
A dedicated training area where people practise standard work and skills before working on the line.
Three stages of mastery: shu (follow the form), ha (break from it with understanding), ri (go beyond it).
Takashi Harada's self-reliance method for setting goals and building daily routines toward them.
Adding planning, problem-solving and responsibility to a job so it is more meaningful.
Tuckman's stages of team development.
Look, Ask, Model, Discuss, Act: a learning cycle from lean product development, similar to PDCA.
Keep, Problem, Try: a simple format for a team reflection on what to keep doing, what went wrong and what to try next.
Japanese for death from overwork; a reminder that muri harms people.
Kazuo Inamori's system at Kyocera of running the company as many small, self-accounting units.
Toyota's phrase for respect for people: making full use of each person's abilities.
Extending flow and pull from one plant across suppliers, distribution and customers, so the whole chain carries less inventory and responds faster.
Working directly with suppliers to improve their quality, delivery and cost, rather than only switching suppliers when they fail.
A Japanese group of companies linked by long-term relationships and cross-shareholdings, such as Toyota and its key suppliers.
A supplier association, such as Toyota's, through which suppliers share improvement methods.
The supplier monitors and replenishes the customer's stock within agreed limits.
Moving inbound goods directly to outbound transport with little or no storage in between.
Applying flow and pull to transport and warehousing: frequent small deliveries, milk runs and levelled shipments.
Applying lean to storage and picking: slotting by usage, short pick paths and visual stock control.
Placing the fastest-moving (A) items closest to the pick or shipping point.
A retail supply-chain strategy of sharing demand data so suppliers replenish to actual sales.
Moving material from suppliers into the plant.
Moving finished goods from the plant to customers.
A closed circuit of material, containers and kanban between a supplier and a user.
A data-driven method for reducing variation and defects, using DMAIC and statistical tools, and named after a capability of about 3.4 defects per million opportunities.
A combination of lean (flow and waste removal) and Six Sigma (variation reduction), often run through DMAIC with tools from both.
Define, Measure, Analyze, Improve, Control: the five-phase Six Sigma improvement method.
Eliyahu Goldratt's management philosophy that every system has a constraint, and improving anything else does not improve the system.
TOC's process: identify the constraint, exploit it, subordinate everything else to it, elevate it, and repeat.
Rajan Suri's lead-time reduction strategy for high-mix, low-volume and custom work, built on cells, MCT mapping and POLCA.
Lean applied to engineering and design: a chief engineer, set-based concurrent engineering, rapid learning cycles and early involvement of manufacturing.
Lean applied to building projects: pull planning, reliable promises, takt planning and reduced waste on site.
Define, Measure, Analyze, Design, Verify: the Six Sigma method for designing a new process or product.
Building Six Sigma quality into a product or process at the design stage.
A Six Sigma practitioner trained to lead improvement projects full time. Green Belts lead smaller projects part time; Master Black Belts coach and teach.
TOC's logic trees, such as the current reality tree and future reality tree, for finding core problems and testing solutions.
TOC applied to projects: schedules built around resource constraints, with safety pooled into project and feeding buffers.
The longest chain of dependent tasks in a project, which sets its minimum duration.
A bar chart of project tasks against time.
QRM's lead-time metric: the typical calendar time from order to delivery along the critical path.
An approach to software and project work built on short iterations, close customer collaboration and responding to change.
The 2001 statement of four values and twelve principles behind agile software development.
An agile framework of fixed-length sprints, a product backlog and defined team roles.
David Anderson's approach to knowledge work: visualise work, limit WIP and manage flow.
Manufacturing designed to respond quickly to changing customer needs, often through flexible technology and organisation.
Eric Ries's method of testing business ideas with a minimum viable product and learning from real customers (build, measure, learn).
The simplest version of a product that lets a team learn whether customers want it.
A one-page business model template for startups.
User-experience design using quick experiments and team collaboration rather than heavy documentation.
A stacked area chart of work items in each state over time, used to see WIP and flow in knowledge work.
The value lost per unit of time by delivering something later.
Weighted Shortest Job First: ranking work by cost of delay divided by job size.
Exploring several design alternatives in parallel and narrowing them as knowledge grows, instead of picking one early.
Toyota's single leader responsible for a product's success, from concept to launch, with authority through knowledge rather than rank.
A chart of how two design characteristics trade against each other, built from test data and reused across projects.
The point after which a design is no longer changed except by formal change control.
Design for Manufacture and Assembly: designing parts that are easy and cheap to make and put together.
Systematically reviewing a design's functions to deliver them at lower cost. Value analysis does the same for existing products.
Translating customers' feelings and impressions of a product into design parameters.
Design Review Based on Failure Mode: Toyota's review of what could go wrong because of a design change.
Japanese for "preventing problems before they happen," the philosophy behind DRBFM and GD3 (good design, good discussion, good dissection).
A lean construction planning system in which the people who do the work make reliable weekly commitments, tracked as percent plan complete.
Planning a project backwards from a milestone, with each trade stating what it needs from the one before.
Dividing a building into zones and moving trades through them at a fixed rhythm.
Designing a construction project to a target cost set from the owner's value, rather than estimating after design.
A decision method that compares alternatives by the importance of their advantages, used in lean construction.
A contract model that brings owner, designer and builder into one team with shared risk and reward.
Lean applied to hospitals and clinics: patient flow, standard work, visual management and reducing waiting.
Lean applied to administrative and transactional work such as orders, invoices and approvals.
Mapping a service from the customer's actions to front-stage and back-stage processes.
A mixed-model flow manufacturing method developed by John Costanza.
A lean framework by Kaizen Institute that links production flow with internal logistics and supply-chain flow.
A system of autonomous, cooperating units (holons) that organise themselves to meet production goals.
Computer-controlled machines and material handling that can make a variety of parts with little changeover.
A system designed to be reconfigured quickly as products or volumes change.
Volkswagen's modular transverse platform, an example of sharing modules across many products.
Toyota executive (1912 to 1990) who developed most of the Toyota Production System, including kanban and the seven wastes.
Industrial engineer (1909 to 1990) who developed SMED and Zero Quality Control and worked closely with Toyota.
American statistician (1900 to 1993) whose teaching on variation, systems and management transformed Japanese quality after 1950.
Founder of the Toyoda loom business whose automatic loom stopped itself when a thread broke: the origin of jidoka.
Founder of Toyota Motor Corporation, who set out the just-in-time idea.
Founder of Ford Motor Company and the moving assembly line; his flow thinking influenced Toyota.
Father of scientific management, who studied work with stopwatches to find the "one best way."
Pioneers of motion study who broke work into basic motions (therbligs).
Bell Labs statistician who invented the control chart and the cycle Deming later taught as PDCA.
Quality pioneer known for the Juran trilogy (planning, control, improvement) and the Pareto principle in quality.
Japanese quality expert who popularised quality circles and the cause-and-effect diagram.
Physicist and author of The Goal, who developed the Theory of Constraints.
Author of The Toyota Way and many studies of Toyota's management.
Authors of The Machine That Changed the World and Lean Thinking, who brought the word lean to a wide audience.
Co-author of Learning to See (value stream mapping) and author of Toyota Kata.
The Union of Japanese Scientists and Engineers, which invited Deming to Japan and awards the Deming Prize.
Deming's fourteen points for management, such as "drive out fear" and "cease dependence on mass inspection."
Mass production of standardised products on moving lines with specialised labour and high wages.
Henri Fayol's classical management theory of planning, organising, commanding, coordinating and controlling.
19th-century approach based on interchangeable parts and specialised machinery.
Craft-based production in which skilled workers hand-fitted parts to each other.
The Toyota and General Motors joint venture in Fremont, California, which showed TPS could work with an American workforce.
Goldratt's 1984 novel that introduced the Theory of Constraints through a plant manager's story.
No terms match that search. Try a broader word such as "flow" or "quality".
Ten scenes from the mill. Pick the lean tool or idea at work.
Five hundred terms can feel like a lot. Real lean programmes start with a handful of moves, in roughly this order.
Stand at the process before you change it, and talk to the people who run it. Uses: genchi genbutsu, gemba walk, Ohno circle, waste walk.
Get people, machines, material and methods predictable before adding flow or pull. Uses: basic stability, standardized work, TPM.
Organise the area so anything abnormal stands out at a glance. Uses: 5S, shadow boards, visual management, hour-by-hour boards.
Pick one product family and follow it end to end; most lead time will be waiting. Uses: value stream mapping, product family, process cycle efficiency.
Improve the step that limits the whole system before anything else. Uses: bottleneck, five focusing steps, OEE.
Cut changeover time so you can run smaller lots and cycle through products more often. Uses: SMED, EPEI, FIFO lanes.
Give people and machines the means to stop at the first defect, and respond fast. Uses: jidoka, andon, poka-yoke, line stop.
Smooth volume and mix so upstream processes see steady demand. Uses: heijunka, pacemaker process, takt time.
Let consumption trigger production and cap the inventory between steps. Uses: kanban, supermarkets, CONWIP.
Make improvement a daily habit by teaching a method and coaching it, not by issuing answers. Uses: A3, Toyota Kata, TWI, kaizen teian.
Most lean arithmetic fits on a calculator, but a spreadsheet keeps it honest and repeatable. The numbers below match the experiments above.
| Function | Syntax | Purpose | When to use it |
|---|---|---|---|
ROUNDUP | ROUNDUP(number, num_digits) | Round up to a given number of digits | Kanban counts and minimum stations or operators, which can never be fractional. |
PRODUCT | PRODUCT(number1, [number2], …) | Multiply all arguments | OEE from availability, performance and quality; rolled throughput yield from step yields. |
SUMPRODUCT | SUMPRODUCT(array1, [array2], …) | Sum of element-by-element products | Total work content of a product mix, such as minutes per joint times joints per size. |
MAX / MIN | MAX(number1, [number2], …) | Largest or smallest value | Find the busiest station to compare with takt, or the shortest cycle in a time study. |
COUNTIFS | COUNTIFS(criteria_range1, criteria1, [criteria_range2, criteria2], …) | Count records meeting one or more conditions | Tally defect codes or andon calls by type and shift before drawing a Pareto chart. |
SUMIFS | SUMIFS(sum_range, criteria_range1, criteria1, [criteria_range2, criteria2], …) | Sum values meeting one or more conditions | Total downtime minutes by loss category for the six big losses. |
Takt time: put available minutes in B2 (1260) and daily demand in B3 (420). =B2/B3 returns 3 minutes per joint.
Stations needed and the bottleneck: with station work content 2.2, 1.8, 3.4 and 1.4 minutes in C2:C5, =ROUNDUP(SUM(C2:C5)/(B2/B3),0) returns 3, the minimum number of balanced stations. =MAX(C2:C5)>B2/B3 returns TRUE: station 3 is over takt, exactly as the yamazumi experiment shows.
OEE: with 0.85, 0.90 and 0.97 in D2:D4, =PRODUCT(D2:D4) returns 0.742, an OEE of about 74%.
Little's Law: with 1200 joints of WIP in E2 and 400 joints a day of throughput in E3, =E2/E3 returns a lead time of 3 days.
Kanban count: =ROUNDUP(400*1.5*(1+0.2)/50,0) returns 15 cards for daily demand of 400, a 1.5-day replenishment time, 20% safety stock and 50 per container.
Pareto preparation: if defect codes are in F2:F501, =COUNTIFS(F2:F501,"Wall thickness") counts one code. List the counts in G2:G15, sort them largest first, and =SUM($G$2:G2)/SUM($G$2:$G$15) filled down gives the cumulative percentage line.
For the ASQ CSSBB and CQE exams, keep the definitions straight: takt is set by demand, cycle time by the process, and lead time includes all the waiting. Little's Law questions usually give two of WIP, throughput and lead time and ask for the third. In OEE questions, setups and breakdowns are availability losses, small stops and slow running are performance losses, and scrap and rework are quality losses. In SMED questions, the first step is always separating internal from external setup. Know that kanban limits inventory by limiting cards, that heijunka levels mix and volume while line balancing levels work between stations, and that jidoka is the principle while poka-yoke is one way to achieve it.
Software references: Microsoft Excel functions (alphabetical); Quality tools in Minitab.
Knowledge check
Pick the strongest answer, then submit. Explanations appear after you submit.