UpSkill Sprint Consulting logoUpSkill Sprint Consulting

The Lean: A Field Guide to Bias

Bias never averages out.

Bias is the lean that doesn't cancel out. Take more samples, run more tests, collect more data, and it stays right where it is. Try it on the gauge target.

This lesson covers what bias is, the three families it comes in, 83 named biases with worked examples, a quiz, and a toolkit for pushing back.

Green dot is the true value. Take measurements and watch where their average lands.
Free printable posters

Take the posters with you

Three one-page PDF posters to print for the office wall, share with your team, or keep beside you during your next analysis.

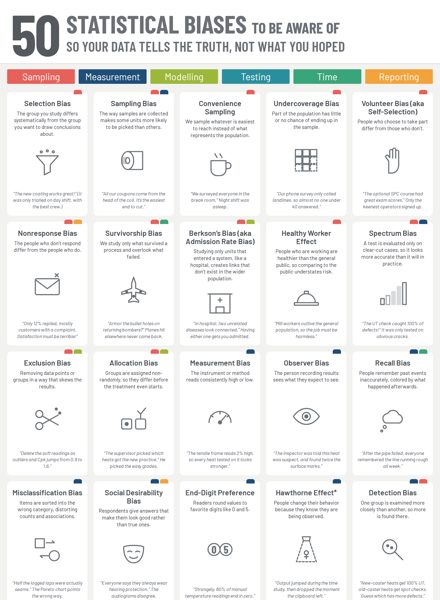
NewPreview of the 50 Statistical Biases poster

50 Statistical Biases

PDF, 1 page, 237 KB. Sampling, measurement, modelling, testing, time and reporting.

Download PDF
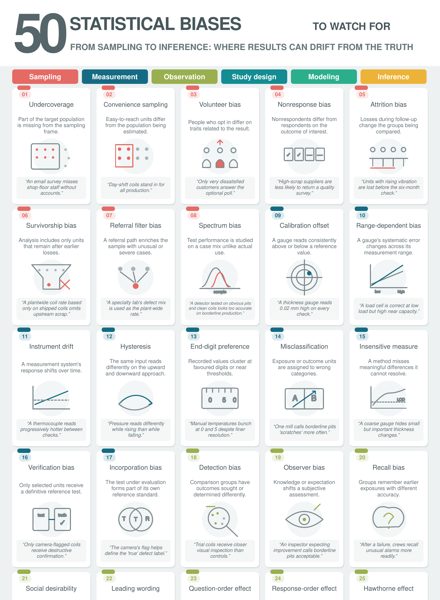
Edition 2Preview of the 50 Statistical Biases poster, edition 2

50 Statistical Biases, Edition 2

PDF, 1 page, 177 KB. Numbered 1 to 50 from sampling to inference, with quality and mill examples.

Download PDF
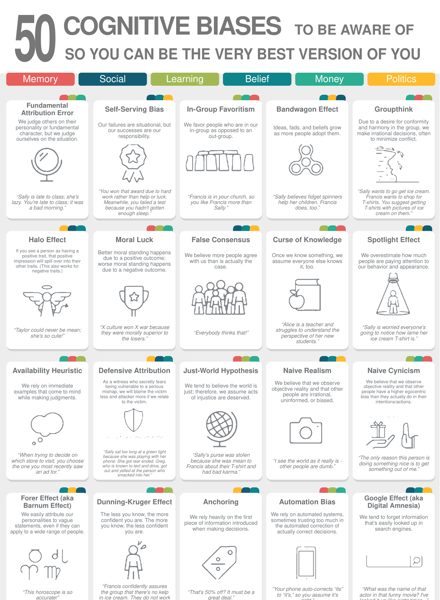
ClassicPreview of the 50 Cognitive Biases poster

50 Cognitive Biases

PDF, 1 page, 332 KB. Poster by TitleMax.

Download PDF

So what is bias, exactly?

Bias is a systematic error: a consistent tendency for a result to be pushed away from the truth in one direction. It comes from how data is collected, how it's measured, how it's analyzed, or how the human in the loop thinks about it.

The key word is systematic. Random error scatters results around the truth, so averaging helps. Bias moves the whole scatter, so averaging just gives you a very precise wrong answer. In MSA terms, noise is a precision problem and bias is an accuracy problem.

The word shows up in two worlds that turn out to be the same world:

In statistics, an estimator is biased when its average across repeated samples doesn't equal the value it's trying to estimate.

In psychology, a cognitive bias is a predictable shortcut in human judgement that bends conclusions the same way every time.

Both are a thumb on the scale. One lives in the data pipeline, the other lives in our heads, and most real failures involve both.

\[\operatorname{Bias}(\hat{\theta})=\mathbb{E}[\hat{\theta}]-\theta\]
The average of your estimates θ̂ minus the true value θ. Zero means unbiased.
\[\operatorname{MSE}(\hat{\theta})=\operatorname{Bias}(\hat{\theta})^{2}+\operatorname{Var}(\hat{\theta})\]
Total error has two parts. A bigger sample shrinks the variance term toward zero. The bias term doesn't budge.
\[s^{2}=\frac{\sum_{i=1}^{n}(x_i-\bar{x})^{2}}{n-1}\]
A classic case: dividing by n instead of n − 1 makes the sample variance biased low, by a factor of (n − 1)/n. Bessel's correction removes it.

Bessel's correction, simulated

3,000 simulated samples at each size, drawn from a population with true variance 1.

True varianceDivide by n (biased)Divide by n − 1 (unbiased)

More data fixes noise. Only better design fixes bias.

Where would you add armor?

World War II. Bombers come back from missions riddled with bullet holes, clustered on the wings, the tail and the middle of the fuselage. Armor is heavy, so you can only add it in a few places. The military's first instinct was to reinforce where the holes were.

Statistician Abraham Wald, working with the Statistical Research Group at Columbia, pointed out what everyone was missing. Take a guess before you reveal it.

Armor the places without holes: the engines and cockpit. The sample only contained planes that made it home. Planes hit in those spots didn't come back to be counted. The missing data was the most important data.

That's survivorship bias, and it's hiding in more plant data than you'd think. A model trained only on pipe that reached final inspection has never seen the pipe that was scrapped upstream.

The same trap, on the pipe line

Every pipe that gets scrapped upstream disappears from the final inspection database. Build a model on that database and it has never seen a failure. Illustrative numbers.

Three families of bias

A useful way to sort the whole zoo is by where the lean enters: the data and the math, the people making judgements, or the system everyone operates inside.

Statistical

Built into how data is sampled, measured, modelled and monitored. It skews numbers even when every person involved is being careful and fair.

"Is the data a fair picture of reality?"

Human

Cognitive shortcuts in memory, social behaviour and belief. Fast and usually useful, but predictably wrong in specific situations.

"Am I seeing what's there, or what I expect?"

Systemic

Embedded in history, social norms and institutional rules. Nobody has to intend it; the structure produces it and the data records it faithfully.

"What did the past bake into the data?"

How the 83 split up

Where bias sneaks into a study

Each stage of turning reality into a decision has its own biases. Select a stage to jump to its biases in the field guide.

    Watch bias happen

    Five small experiments with simulated data. Press the buttons and watch the lean appear.

    Sampling bias: the easy coupon

    Toughness varies along this simulated coil: the slower-cooled middle is weaker. Cutting test coupons from the head is convenient. See what it does to the estimate.

    Pick a sampling plan.

    Nonresponse: the loud 12%

    400 customers surveyed, 48 replied. Each square is one customer.

    UnhappySatisfiedDidn't reply
    Illustrative numbers.

    Model selection: test enough, find something

    Chance of at least one false "significant" result when testing variables that truly have no effect, at α = 0.05.

    Clustering illusion: random defects

    30 defects placed completely at random along a 12 m pipe. The shaded band is the densest metre.

    Gambler's fallacy: is it "due"?

    100 fair coin flips. The ringed run is the longest streak. Streaks are normal in random data.

    The field guide: 83 biases

    Every bias from your six reference graphics, merged where they overlap, each with a plain definition and a worked example. Tap "Show example" on any card. Graphic numbers refer to the order the images were shared.

    Selection and sampling Who or what ended up in the data

    Selection bias

    The group you study differs systematically from the group you want conclusions about.

    Show example
    A new rolling lubricant is trialled only on day shift, where the most experienced crew runs. It looks brilliant, then disappoints when rolled out to all four crews.
    Statistical. Graphic 2, 3

    Sampling bias

    The collection method makes some units more likely to be picked than others, so the sample stops being random.

    Show example
    Charpy coupons are always cut from the head of the coil because it is easiest to reach. The middle and tail, where cooling differs, are never tested.
    Statistical. Graphic 1, 2, 4, 6

    Attrition bias

    People or units drop out partway through a study, and the ones who leave differ from the ones who stay.

    Show example
    A 12-week fitness program reports amazing results. The participants who were struggling quit by week four, so only the success stories finished.
    Statistical. Graphic 1

    Survivorship bias

    Only the survivors are visible, so the failures that would change the story are missing.

    Show example
    "Dropouts like Gates and Zuckerberg became billionaires, so college is optional." Thousands of dropouts whose startups failed never get magazine covers.
    Statistical. Graphic 1, 3, 5, 6

    Self-selection bias

    People choose whether to be included, and the people who opt in differ from those who don't.

    Show example
    An optional SPC course shows excellent post-test scores. The operators who signed up were already the most motivated ones on the floor.
    Statistical. Graphic 1, 3, 6

    Nonresponse bias

    The people who don't answer differ in important ways from the people who do.

    Show example
    A customer satisfaction survey gets a 12% response rate, mostly from customers with an open claim. Management concludes everyone is unhappy.
    Statistical. Graphic 1, 6

    Undercoverage bias

    Part of the population has little or no chance of being included in the sample at all.

    Show example
    A community survey done only by landline barely reaches anyone under 40, then reports that residents strongly prefer the old way of doing things.
    Statistical. Graphic 1

    Exclusion bias

    Data points or groups are removed, carelessly or deliberately, in a way that skews results.

    Show example
    Soft hardness readings are deleted as "outliers" before a capability study. Cpk looks great, and the customer finds the real soft spots.
    Statistical. Graphic 2

    Representation bias

    The data under-represents conditions or groups the conclusion or model will later face.

    Show example
    A surface-defect vision model is trained mostly on summer production and struggles in winter, when scale patterns look different.
    Statistical. Graphic 4

    Temporal bias

    Data from one period is treated as if it describes a different period.

    Show example
    Control limits are set from the quarter right after a furnace reline. Normal ageing later gets flagged as out of control week after week.
    Statistical. Graphic 4

    Measurement and reporting How the data got recorded

    Measurement bias

    The measuring process reads consistently high or low, or measures some groups differently from others.

    Show example
    One tensile frame's load cell reads 2% high. Every heat tested on it looks stronger than it is. This is exactly what the bias study in MSA is for.
    Statistical. Graphic 2, 4

    Recall bias

    People remember past events inaccurately, coloured by what happened afterwards or how they feel now.

    Show example
    After a pipe fails hydrotest, the crew recalls the mill "running rough all week." Before the failure, nobody wrote anything down.
    Statistical. Graphic 1, 2, 3, 6

    Observer bias

    The person recording results sees what they expect to see.

    Show example
    An inspector told a heat is "suspect" logs more borderline surface marks on it than on an identical heat labelled good.
    Statistical. Graphic 3

    Human reporting bias

    What gets written down reflects what people find notable, not how often things actually happen.

    Show example
    Shift logs record every breakdown and none of the uneventful hours. Read the logs alone and the machine looks far worse than its uptime says.
    Statistical. Graphic 4

    Funding bias

    Results tend to tilt towards the interests of whoever paid for the study.

    Show example
    A refractory supplier sponsors a comparison trial. Their brick wins. The independent trial next year is far less conclusive.
    Statistical. Graphic 3

    Surveys and interviews How the asking shapes the answer

    Interview bias

    The interviewer's wording, tone, body language or reactions nudge how people answer.

    Show example
    An auditor asks, "You always verify the torque before release, right?" and nods encouragingly. Every operator says yes, including the ones who don't.
    Statistical. Graphic 6

    Demand characteristics bias

    Participants work out what the study is looking for and change their answers or behaviour to fit it.

    Show example
    Operators learn the survey is part of a 5S push, so the question "How organised is your work area?" gets glowing scores in the messiest bays.
    Statistical. Graphic 6

    Extreme response bias

    Some respondents habitually pick the endpoints of a scale, regardless of how strongly they actually feel.

    Show example
    One site rates every item on a supplier scorecard 1 or 5. Averaged with sites that use the whole scale, their ratings dominate the result.
    Statistical. Graphic 6

    Neutral response bias

    Respondents default to the middle option to avoid committing, which hides real opinions. Also called central tendency bias.

    Show example
    A 40-question engagement survey sees answers drift to "3 – neutral" after question 15. Fatigue, not neutrality, is doing the answering.
    Statistical. Graphic 6

    Question order bias

    Earlier questions prime how people answer later ones.

    Show example
    Ask about last month's recall first and "How would you rate our overall quality?" scores drop. Ask it first and the same customers rate it higher.
    Statistical. Graphic 6

    Conformity bias

    People give the answer they think the group or the majority holds, rather than their own view.

    Show example
    In a show-of-hands vote on whether the new procedure is workable, hands go up once the supervisor's does. The anonymous version tells a different story.
    Human. Graphic 6

    Analysis and models How the data got interpreted or used by models

    Omitted variable bias

    A factor that affects both the supposed cause and the outcome is left out, so its effect gets credited to something else.

    Show example
    A new operator seems to produce more defects. He's only scheduled on the hardest grades. Grade, the missing variable, drives both.
    Statistical. Graphic 3

    Cause-effect bias

    Treating correlation as causation, or getting the direction of cause wrong.

    Show example
    Lines with more inspectors record more defects. Removing inspectors won't improve quality; they find defects, they don't cause them.
    Statistical. Graphic 3

    Model selection bias

    Trying many models or variables and reporting only the best fit, which overstates how well it will really perform.

    Show example
    Forty process variables are each tested against Charpy energy. At α = 0.05, about two will look significant by pure chance.
    Statistical. Graphic 4

    Concept drift

    The relationship a model learned changes over time, so its predictions quietly degrade.

    Show example
    A scrap-mix model was trained before a new scrap supplier arrived. Tramp-element chemistry shifted and the model never noticed.
    Statistical. Graphic 4

    Feedback loops

    A model's outputs shape the data it later learns from, reinforcing its own assumptions.

    Show example
    Inspection effort goes to heats the model flags as risky, so most defects get found there, which "confirms" the model and sharpens its focus further.
    Statistical. Graphic 4

    Error propagation

    Small errors early in a pipeline compound through each later step.

    Show example
    A thermocouple reads 15°C low. It feeds a temperature model, then a cooling-rate estimate, then a hardness prediction, each inheriting the error.
    Statistical. Graphic 4

    Deployment bias

    A system is used in a way that differs from how it was designed and validated.

    Show example
    A tool built to decide which coils to inspect first ends up being used to decide which coils to skip inspecting entirely.
    Human. Graphic 4

    Selective adherence

    Following a model's recommendation only when it matches what we already believe.

    Show example
    A supervisor accepts the model's "hold this heat" flags on grades he distrusts, and overrides the identical flag on his favourite grade.
    Human. Graphic 4

    Automation bias

    Trusting an automated system over our own correct judgement or contradictory evidence.

    Show example
    The vision system says "pass," so the inspector waves through a pipe with a lap he can plainly see on the end.
    Human. Graphic 5

    Judgement and memory How individual minds process information

    Anchoring

    Leaning too heavily on the first number or piece of information we encounter.

    Show example
    A contractor opens at $90k. The revised $70k feels like a bargain, even though comparable jobs run about $50k.
    Human. Graphic 5

    Availability heuristic

    Judging how likely something is by how easily examples come to mind.

    Show example
    After a plane crash dominates the news, people choose to drive instead of fly, which is statistically far riskier.
    Human. Graphic 5

    Framing effect

    Reacting differently to the same information depending on how it's presented.

    Show example
    "95% first-pass yield" gets applause. "One pipe in twenty needs rework" gets an action plan. Same number.
    Human. Graphic 5

    Sunk cost fallacy

    Continuing because of what has already been spent rather than what lies ahead. Also called escalation of commitment.

    Show example
    "We've put $400k into this upgrade, we can't stop now," said after trials show it doesn't fix the defect it was bought for.
    Human. Graphic 4, 5

    Status quo bias

    Preferring things to stay the same, so any change feels like a loss.

    Show example
    A paper check sheet survives for years "because it works," even though a tablet would catch out-of-spec entries in real time.
    Human. Graphic 5

    Zero-risk bias

    Preferring to eliminate a small risk entirely over substantially reducing a larger one.

    Show example
    The safety budget goes to eliminating a once-a-decade hazard completely, while the daily forklift risk gets a token fix.
    Human. Graphic 5

    Gambler's fallacy

    Believing past independent random events change the odds of future ones.

    Show example
    "Red came up six times, black is due." The roulette wheel has no memory.
    Human. Graphic 5

    Clustering illusion

    Seeing meaningful patterns or streaks in random data.

    Show example
    Three defects in the same pipe position looks like a trend. With enough pipe, random clusters are guaranteed. Test before you chase.
    Human. Graphic 5

    Law of triviality

    Spending disproportionate time on trivial issues because they're easy to have opinions about. Also called bike-shedding.

    Show example
    A 90-minute meeting: 60 minutes on the new report template's colours, five on the customer claim.
    Human. Graphic 5

    Dunning-Kruger effect

    People with limited skill in an area tend to overrate it, while experts see how much they don't know.

    Show example
    After one online stats course, someone confidently declares a gauge R&R study "a waste of time."
    Human. Graphic 5

    Curse of knowledge

    Once we know something, it's hard to imagine not knowing it.

    Show example
    A 25-year veteran writes a work instruction that skips every step he considers obvious. New hires are lost by step three.
    Human. Graphic 5

    Google effect

    Forgetting information we know we can easily look up. Also called digital amnesia.

    Show example
    You know exactly where the spec table lives on the shared drive but can't recall a single value in it.
    Human. Graphic 5

    Zeigarnik effect

    Unfinished tasks stick in memory more than completed ones.

    Show example
    You can recite the three open corrective actions in detail but can't remember the twelve you closed last month.
    Human. Graphic 5

    IKEA effect

    Placing extra value on things we built or partly created ourselves.

    Show example
    Defending your homemade spreadsheet tool long after a better, supported option became available.
    Human. Graphic 5

    Tachypsychia

    Our sense of time stretches or compresses under stress, fear or exertion.

    Show example
    A near-miss with a crane load "lasted forever," says the witness. The camera shows two seconds. It matters when taking incident statements.
    Human. Graphic 5

    False memory

    Remembering events that didn't happen, or that happened differently.

    Show example
    Two operators give confident, contradictory accounts of which alarm sounded first. The alarm log agrees with neither.
    Human. Graphic 5

    Suggestibility

    Taking on ideas suggested by others as our own memories or conclusions.

    Show example
    "Did you see sparks before it broke?" The leading question plants sparks in the witness's memory.
    Human. Graphic 5

    Cryptomnesia

    A forgotten memory resurfaces and is mistaken for a brand-new idea.

    Show example
    You pitch a "totally original" improvement idea, then realise you heard it at a conference last spring.
    Human. Graphic 5

    Declinism

    Romanticising the past and expecting the future to be worse.

    Show example
    "Quality was better in the old days." The old scrap records strongly disagree.
    Human. Graphic 5

    Pessimism bias

    Overestimating the likelihood of bad outcomes.

    Show example
    Refusing to trial a promising process change because "it will definitely generate scrap."
    Human. Graphic 5

    Optimism bias

    Overestimating the likelihood of good outcomes.

    Show example
    A commissioning schedule assumes every step works first time. It never has, on any project, anywhere.
    Human. Graphic 5

    Placebo effect

    Believing a treatment will work can produce real improvement. Flagged in the source graphic as not strictly a cognitive bias.

    Show example
    Patients given a sugar pill they believe is a painkiller report meaningfully less pain. That's why good trials use a placebo control group.
    Human. Graphic 5

    Social and group How people judge each other and move together

    Fundamental attribution error

    Blaming other people's behaviour on their character and our own on circumstances.

    Show example
    When night shift scraps a coil, "they're careless." When we do, "the mill was acting up."
    Human. Graphic 5

    Self-serving bias

    Crediting our successes to our own skill and our failures to outside factors.

    Show example
    Yield up: "our project worked." Yield down: "bad raw material this month."
    Human. Graphic 5

    In-group favouritism

    Giving more trust and leniency to people in our own group.

    Show example
    The melt shop accepts its own explanation for a chemistry miss but demands hard proof from the rolling mill.
    Human. Graphic 5

    Outgroup homogeneity

    Seeing members of other groups as all alike while seeing our own group as diverse.

    Show example
    "IT people all think the same way," says a quality engineer who insists quality engineers are all very different.
    Human. Graphic 5

    Stereotyping

    Assuming an individual has traits we associate with their group, without real information about them.

    Show example
    "She's from head office, she won't understand the shop floor." She ran a mill for eight years.
    Human. Graphic 5

    Implicit bias

    Unconscious associations that shape our judgements without our awareness.

    Show example
    In field experiments, identical résumés received different callback rates depending only on the name at the top.
    Human. Graphic 4

    Groupthink

    The desire for harmony and agreement overrides critical thinking.

    Show example
    In an RCA meeting, nobody challenges the plant manager's favoured root cause, so the fishbone fills up in agreement with it.
    Human. Graphic 4, 5

    Bandwagon effect

    Adopting an idea or behaviour because many others already have.

    Show example
    Every department suddenly needs "an AI dashboard" because other sites have one, whether or not there's a question for it to answer.
    Human. Graphic 5

    Authority bias

    Giving extra weight to an authority figure's opinion regardless of the evidence.

    Show example
    The VP's gut feel about the root cause beats the data in the review meeting.
    Human. Graphic 5

    Halo effect

    One positive trait colours our impression of everything else about a person or thing. It works for negative traits too.

    Show example
    A supplier with a slick presentation and a glossy brochure is assumed to have tight process control as well.
    Human. Graphic 5

    False consensus effect

    Overestimating how many people share our opinions.

    Show example
    "Everyone hates the new system," according to the three people you had lunch with.
    Human. Graphic 5

    Spotlight effect

    Believing others notice our appearance and mistakes far more than they do.

    Show example
    You fumble one slide and assume the whole room is still thinking about it next week. Most forgot by coffee break.
    Human. Graphic 5

    Defensive attribution

    Blaming a victim less when we can imagine being in their position, and more when we can't.

    Show example
    Engineers go easy on a peer's spreadsheet error ("could've been me") but come down hard on an operator for a similar slip.
    Human. Graphic 5

    Bystander effect

    The more people present, the less likely any one of them is to act. Flagged in the source graphic as not strictly a cognitive bias.

    Show example
    Twenty people walk past an oil leak on the walkway, each assuming someone else already reported it.
    Human. Graphic 5

    Ben Franklin effect

    We tend to like people more after doing them a favour.

    Show example
    Asking a sceptical colleague to review your analysis often turns them into its biggest supporter.
    Human. Graphic 5

    Availability cascade

    A belief becomes more credible simply by being repeated in public.

    Show example
    "Wet flux causes all our porosity" gets said in enough meetings that it's treated as fact. Nobody has tested it.
    Human. Graphic 5

    Third-person effect

    Believing other people are more influenced by media and advertising than we are.

    Show example
    "Those ads work on other people, not me," said while wearing the advertised boots.
    Human. Graphic 5

    Belief and persuasion How we decide what is true

    Confirmation bias

    Seeking out, noticing and remembering information that supports what we already believe.

    Show example
    Convinced a sliver defect starts at the caster, a team pulls only caster data and never looks at the reheat furnace.
    Human. Graphic 2, 4, 5, 6

    Belief bias

    Judging an argument's logic by whether we like its conclusion.

    Show example
    A flawed analysis showing your process is capable sails through review. A sound one saying it isn't gets picked apart.
    Human. Graphic 5

    Backfire effect

    Evidence against a belief can make some people hold it more firmly.

    Show example
    Showing a manager that his pet project didn't move the metric leads to a louder defence of the project.
    Human. Graphic 5

    Reactance

    Doing the opposite of what we're told when we feel our freedom is being restricted.

    Show example
    A heavy-handed memo on a new rule triggers more shortcuts than a five-minute conversation explaining why would have.
    Human. Graphic 5

    Naive realism

    Believing we see the world objectively and that people who disagree must be uninformed or biased.

    Show example
    "The data is obvious. Anyone who reads it differently just doesn't get it."
    Human. Graphic 5

    Naive cynicism

    Expecting others to be more self-interested than they really are.

    Show example
    "She only joined the kaizen team to look good for promotion." She joined because the problem annoyed her.
    Human. Graphic 5

    Blind spot bias

    Recognising bias in other people while believing we're less affected ourselves.

    Show example
    Reading this entire field guide and thinking mainly of your co-workers.
    Human. Graphic 5

    Just-world hypothesis

    Assuming people generally get what they deserve.

    Show example
    "He got laid off? He must not have been pulling his weight." The whole department was cut.
    Human. Graphic 5

    Moral luck

    Judging a decision by its outcome rather than by the quality of the decision itself.

    Show example
    Two operators skip the same lockout step. One gets lucky, one causes an incident. Only one gets disciplined.
    Human. Graphic 5

    Forer effect

    Accepting vague, general statements as uniquely accurate descriptions of ourselves. Also called the Barnum effect.

    Show example
    "You have a lot of unused potential and sometimes doubt your decisions." That describes nearly everyone who reads a horoscope.
    Human. Graphic 5

    Ranking bias

    Items placed higher in a list get chosen or trusted more, regardless of merit.

    Show example
    Most clicks go to the top three search results. The supplier listed first in the purchasing dropdown gets picked the most.
    Human. Graphic 4

    Systemic What history and institutions bake in

    Historical bias

    The data accurately records a past that was itself unfair or unrepresentative.

    Show example
    A hiring model trained on 20 years of engineering hires learns that successful engineers are mostly men, because mostly men were hired.
    Systemic. Graphic 4

    Social bias

    Shared norms and stereotypes in society seep into data and decisions.

    Show example
    Image datasets label people in kitchens as women more often than the photos justify, and models trained on them repeat it.
    Systemic. Graphic 4

    Institutional bias

    An organisation's policies and practices produce skewed outcomes even when individuals mean well.

    Show example
    A promotion rule that rewards weekend overtime quietly disadvantages employees with caregiving responsibilities.
    Systemic. Graphic 4

    Name that bias

    Nine scenarios. Pick the bias that's doing the damage.

    How to fight back

    You can't switch bias off, in data or in people. You can design processes that catch it.

    Randomize and stratify

    Let chance pick the sample, and make sure every subgroup gets represented. Beats: sampling, selection, undercoverage, self-selection.

    Count what's missing

    Track dropouts, non-responders, scrapped units and excluded rows. Ask who never made it into the dataset. Beats: survivorship, attrition, nonresponse, exclusion.

    Design the questions carefully

    Use neutral wording, randomize question order, keep surveys short, and collect sensitive answers anonymously. Beats: interview, question order, conformity, demand characteristics, neutral and extreme response.

    Blind the observer

    Hide the group label, heat history or expected answer from whoever measures or judges. Beats: observer, confirmation, halo, implicit.

    Validate the measurement system

    Check bias, linearity, stability and repeatability before trusting the numbers. Beats: measurement, error propagation.

    Decide the test before the data

    Write down the hypothesis and analysis plan first, and correct for multiple comparisons. Beats: model selection, confirmation, clustering illusion.

    Hunt for confounders

    Use designed experiments where you can, and stratify or adjust where you can't. Beats: omitted variable, cause-effect.

    Monitor after launch

    Control-chart model inputs and errors, and audit how the tool is actually used on the floor. Beats: concept drift, feedback loops, deployment, temporal.

    Argue with yourself

    Run a pre-mortem, appoint a devil's advocate, and let the most junior person speak first. Beats: groupthink, authority, bandwagon, sunk cost.

    Judge the decision, not the outcome

    Ask whether the choice was sound given what was known at the time. Beats: moral luck, self-serving, hindsight-driven recall.

    Statistics Implementation

    Use a reference standard to check measurement bias, and compare the sampling mix with the population you intend to describe. A spreadsheet can reveal a mismatch; it cannot repair an unrepresentative sampling plan by itself.

    Excel Functions

    FunctionSyntaxPurposeWhen to use it
    AVERAGEAVERAGE(number1, [number2], …)Mean of measurementsCompare a gauge's mean reading with a known reference.
    VAR.SVAR.S(number1, [number2], …)Sample variance with the n − 1 correctionEstimate variance from a sample of repeated readings.
    VAR.PVAR.P(number1, [number2], …)Variance of the entire supplied population, divided by nUse only when those readings really constitute the entire population of interest.
    COUNTIF / COUNTIFSCOUNTIF(range, criteria)
    COUNTIFS(criteria_range1, criteria1, [criteria_range2, criteria2], …)
    Count records in one or several groupsCompare tested and untested units across shifts, coil positions, or other strata.
    AVERAGEIF / AVERAGEIFSAVERAGEIF(range, criteria, [average_range])
    AVERAGEIFS(average_range, criteria_range1, criteria1, [criteria_range2, criteria2], …)
    Compare means within defined groupsCheck whether day/night or head/middle/tail samples differ.

    Excel Use Cases

    Gauge offset: Enter four readings of a 10.00 mm reference in B2:B5: 10.2, 10.3, 10.1, 10.4. =AVERAGE(B2:B5)-10 gives +0.25 mm. =VAR.S(B2:B5) gives about 0.0167 mm², whereas =VAR.P(B2:B5) gives 0.0125 mm². The first is a sample variance estimate; the second treats these four readings as the full population.

    Coverage audit: If C2:C101 contains shifts and D2:D101 contains “Yes” for sampled units, =COUNTIFS(C2:C101,"Night",D2:D101,"Yes") counts night-shift samples. Divide by COUNTIF(C2:C101,"Night") to compare the night sampling rate with other shifts. Check that the denominator is nonzero.

    Stratified mean: If coil position is in E2:E101 and toughness is in F2:F101, =AVERAGEIF(E2:E101,"Middle",F2:F101) gives the middle-coil mean. For a second condition, =AVERAGEIFS(F2:F101,E2:E101,"Middle",C2:C101,"Night") gives the night-shift middle-coil mean. Treat differences as a cue to investigate the sampling design, not proof of causation.

    Minitab Navigation

    For repeated readings of a reference across the operating range, use Stat → Quality Tools → Gage Study → Gage Linearity and Bias Study. This is the direct choice for checking whether bias changes with the reference value. For repeated readings of one reference part, use Stat → Quality Tools → Gage Study → Type 1 Gage Study to assess bias and repeatability together.

    To compare subgroup counts and means before drawing conclusions from a sample, use Stat → Basic Statistics → Display Descriptive Statistics and specify the response and grouping variable. A descriptive summary helps detect imbalance; it does not make a convenience sample representative.

    Exam Tips

    For CSSBB and CQE practice, first locate where the bias entered: selection, measurement, analysis, or interpretation. In measurement questions, separate bias (average offset from a reference) from repeatability (scatter of repeated readings). In sampling questions, identify who or what is missing before calculating a more precise estimate. State the population and sampling frame explicitly in a real analysis.

    Software references: Microsoft Excel statistical functions; Minitab Gage Linearity and Bias Study; Minitab Type 1 Gage Study; Minitab descriptive statistics.

    Knowledge check

    Check your understanding

    Comprehension quiz

    Pick the strongest answer, then submit. Explanations appear after you submit.

    1. A gauge reads 10.2, 10.3, 10.1 and 10.4 mm for a 10.00 mm reference. Which issue is most directly shown?
    2. A model uses only pipe that reached final inspection. Which missing units should you check?
    3. How should you estimate variance from a sample of repeated gauge readings in Excel?
    4. A survey of 400 customers receives 48 answers, mostly from open-claim accounts. What should you assess first?
    5. What Minitab study fits repeated reference measurements across the gauge’s operating range?
    ← Back to Statistics lessons